Congratulations, you’ve done it again! You finished your last sprint and you’re ready for an alpha launch to show off your sparkly new web app. The design is slick, the functionality is there, and you uploaded the perfect number of cat photos. Everything for the MVP is checking out, but how’s the web app performance? You’ll need to add a performance-tuning step to your process.
Performance tuning is a necessary measure to get the most out of your application. You’ve spent all the effort getting your web app to work, but adoption isn’t going to happen if things are sluggish. Luckily, there’s a new tool for profiling php web apps: Blackfire.io.
Welcome to Blackfire.io
Blackfire.io is a smart web app profiler that highlights important pathways so you can focus on the relevant parts of your php app. It shows memory consumption, CPU time, and I/O, and allows you to sort function calls and pathways to visualize how your app runs.
Installing
installation guide is pretty straightforward. Using an Ubuntu/trusty32 Vagrant box, I was able to follow their Debian/Ubuntu guide with minimal hiccups. The only trick is to make sure you run an apt-get upgrade after your apt-get update because blackfire-agent and blackfire-php want the freshest php. Also, don’t forget to restart apache after you install sudo service apache2 restart or your workers will be stale.
As a side note, Blackfire.io is also available for many PaaS infrastructures for staging/production profiling. The next step is to install Blackfire.io on Heroku once the web app gets deployed for UAT.
Profiling your app
In order to profile a web page request, Blackfire provides a Chrome plugin. The plugin uses the browser to instantiate the request, which runs the profiler on the server. After profiling is complete, the server-side agent sends the profiled data to Blackfire.io, and - Voila! - you have visualization. If you’re looking to profile API or Web Service calls, it’s easiest to use the CLI tool. Note: For the terminal savvy (AKA neckbeards), you can also use the CLI tool to profile web pages.
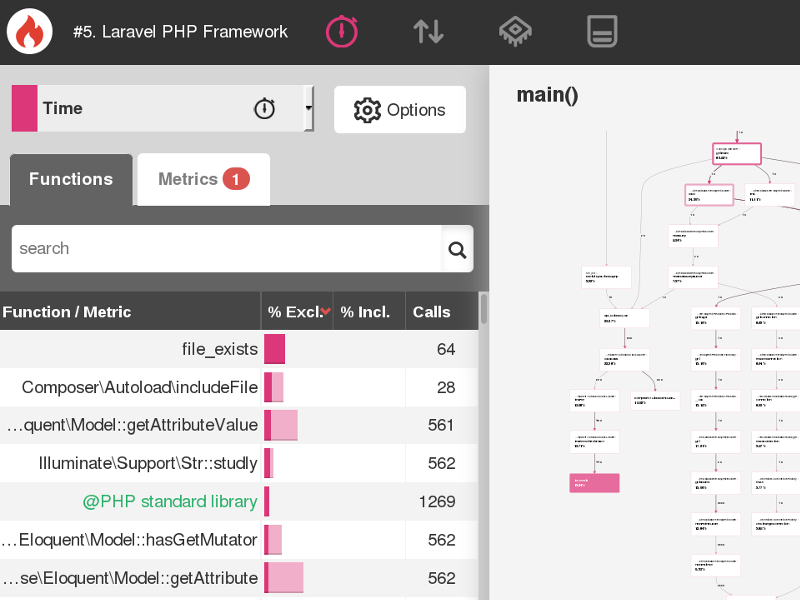
Cool. Now that you’ve profiled that slow web page that was annoying you, you get to check some visuals. You can see the roadmap of the request through functions better than any backtrace, and there’s a scale on the side weighted by CPU time, I/O time, or memory consumption. This is what allows you to truly focus on the meat and potatoes of what’s slowing you down.
Analyse the web app
Let’s take the example of a reporting app. On a particularly large report, there was a 4-5s interval where the server was chewing on the data. Unacceptable.
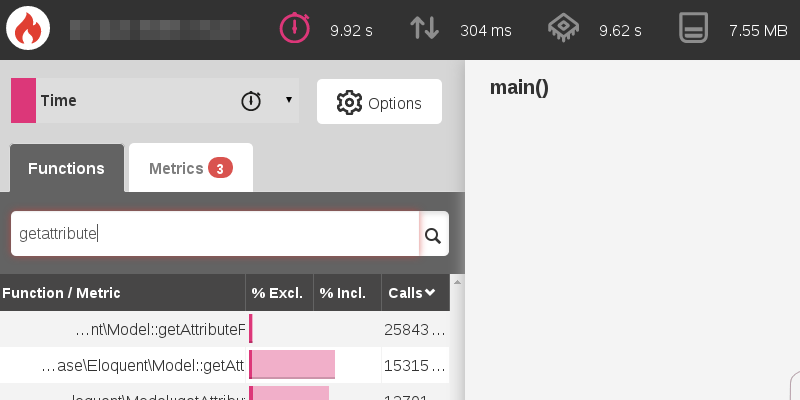
Very quickly, we were able to see that the getAttribute method was called way too much. We were using the ORM to conform to the frameworks style, but we found iteration over the magic getters was causing significant performance issues. We replaced the ORM utilization with a report query, and iterated over an associated array instead.
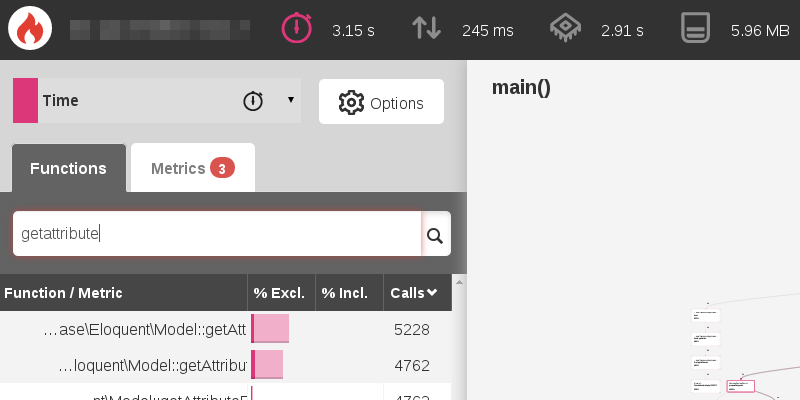
The profiler on a virtual machine seems to exacerbate the total time of the process, but in converting a 9.9s page load to 3.15s, we realized some serious gains. Without the profiler, true page loads on the virtual machine were closer to 0.75s, which was much more acceptable.
Unit-tests
An obligatory mention: unit tests are the kings of performance refinement. Being able to test inputs and outputs for a consistent result doesn’t leave you guessing. After replacing some significant functionality completely, we still knew it was returning the correct data. This made the refactor time much faster because a lot of QA time was mitigated.
Rinse-Repeat
And now you can easily re-run the analysis/refactor cycles on the problem areas of your site until you are satisfied with the performance.
Conclusion
Without knowing exactly what needed to change, we could have wasted time refactoring code that we thought was the problem. Blackfire.io allowed us to quickly identify the root of the performance issues on our web app, resulting in a targeted and effective use of time to refactor the appropriate functionality.