Building modals and modal forms is a common task for Drupal developers. CTools provides a modal framework that adds a lot of structure and simplifies building out this functionality from scratch.
How do you debug? If you’re primarily a PHP developer, you’re used to refreshing the page, printing variables to the screen, using Devel module tools, etc. But what do you do if you get this screen?
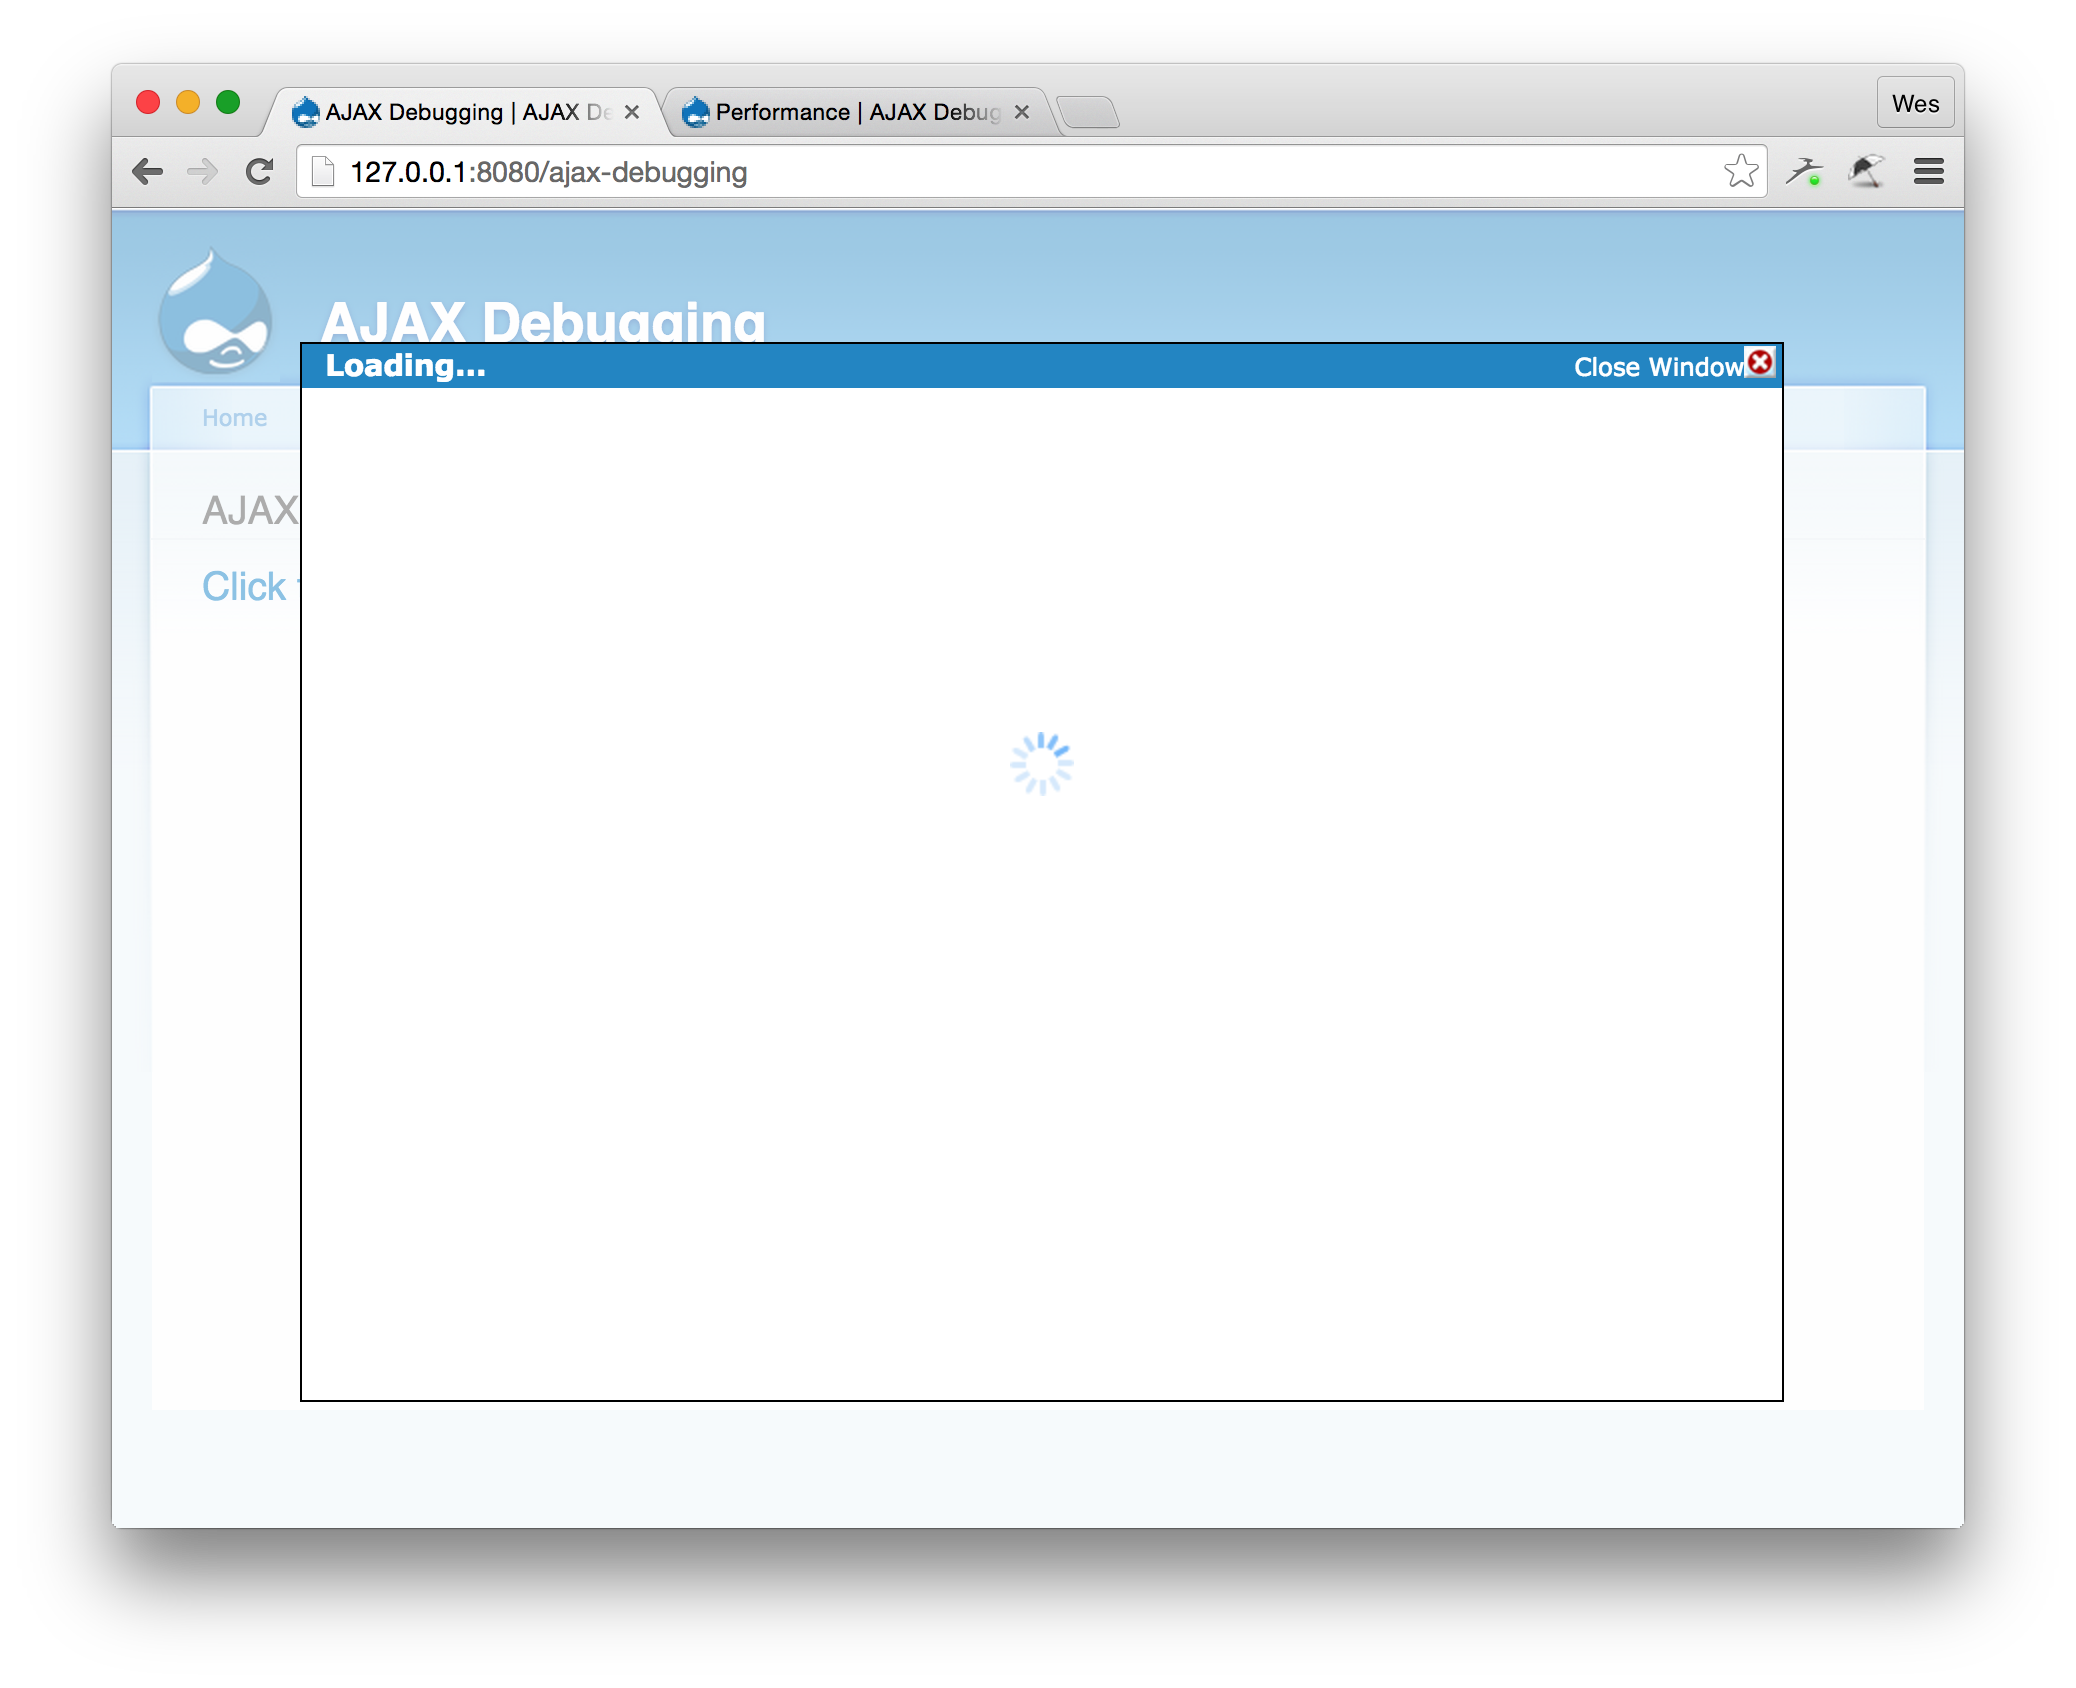
No feedback, no message, just a spinning throbber. Ugh. What happened?
Because the modal content is being loaded in with AJAX, the HTTP request is processed in the background. That means if the request fails, you get no feedback to your current browser view. We need to find another way to debug the modal content.
Network Inspector to the Rescue
That’s where Network Inspector comes in handy. Chrome, Firefox and even Safari have this feature built into their Developer Tools.
Open up Developer Tools and click the “Network” tab:
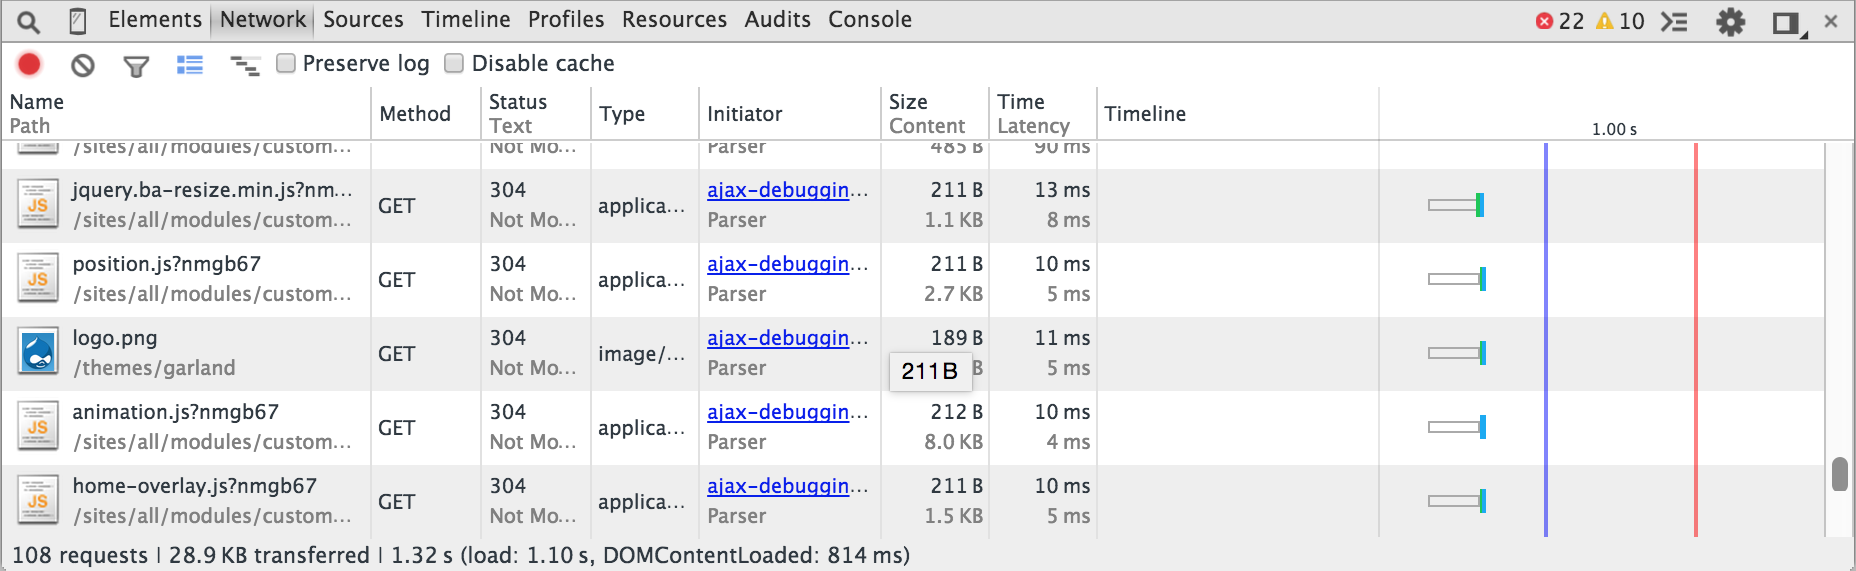
This panel logs every HTTP request that the browser is processing. That includes images, Javascript files, CSS, external scripts such as Google Analytics or Typekit, and any AJAX requests. You can inspect these requests, view the request headers, and view the response. This is perfect for debugging problems with AJAX.
In my example above, something’s gone wrong and the modal content is not loading. How can I resolve this?
Here’s my typical debug workflow for modals:
- Load page with the Ajax triggering element. This is essentially the step right before where you want to debug.
- Open Developer Tools, select Network tab.
- Clear the log - this will make it easier to see your requests.
- Trigger the AJAX event.
- You’ll see the request appear in the log. Click to view.
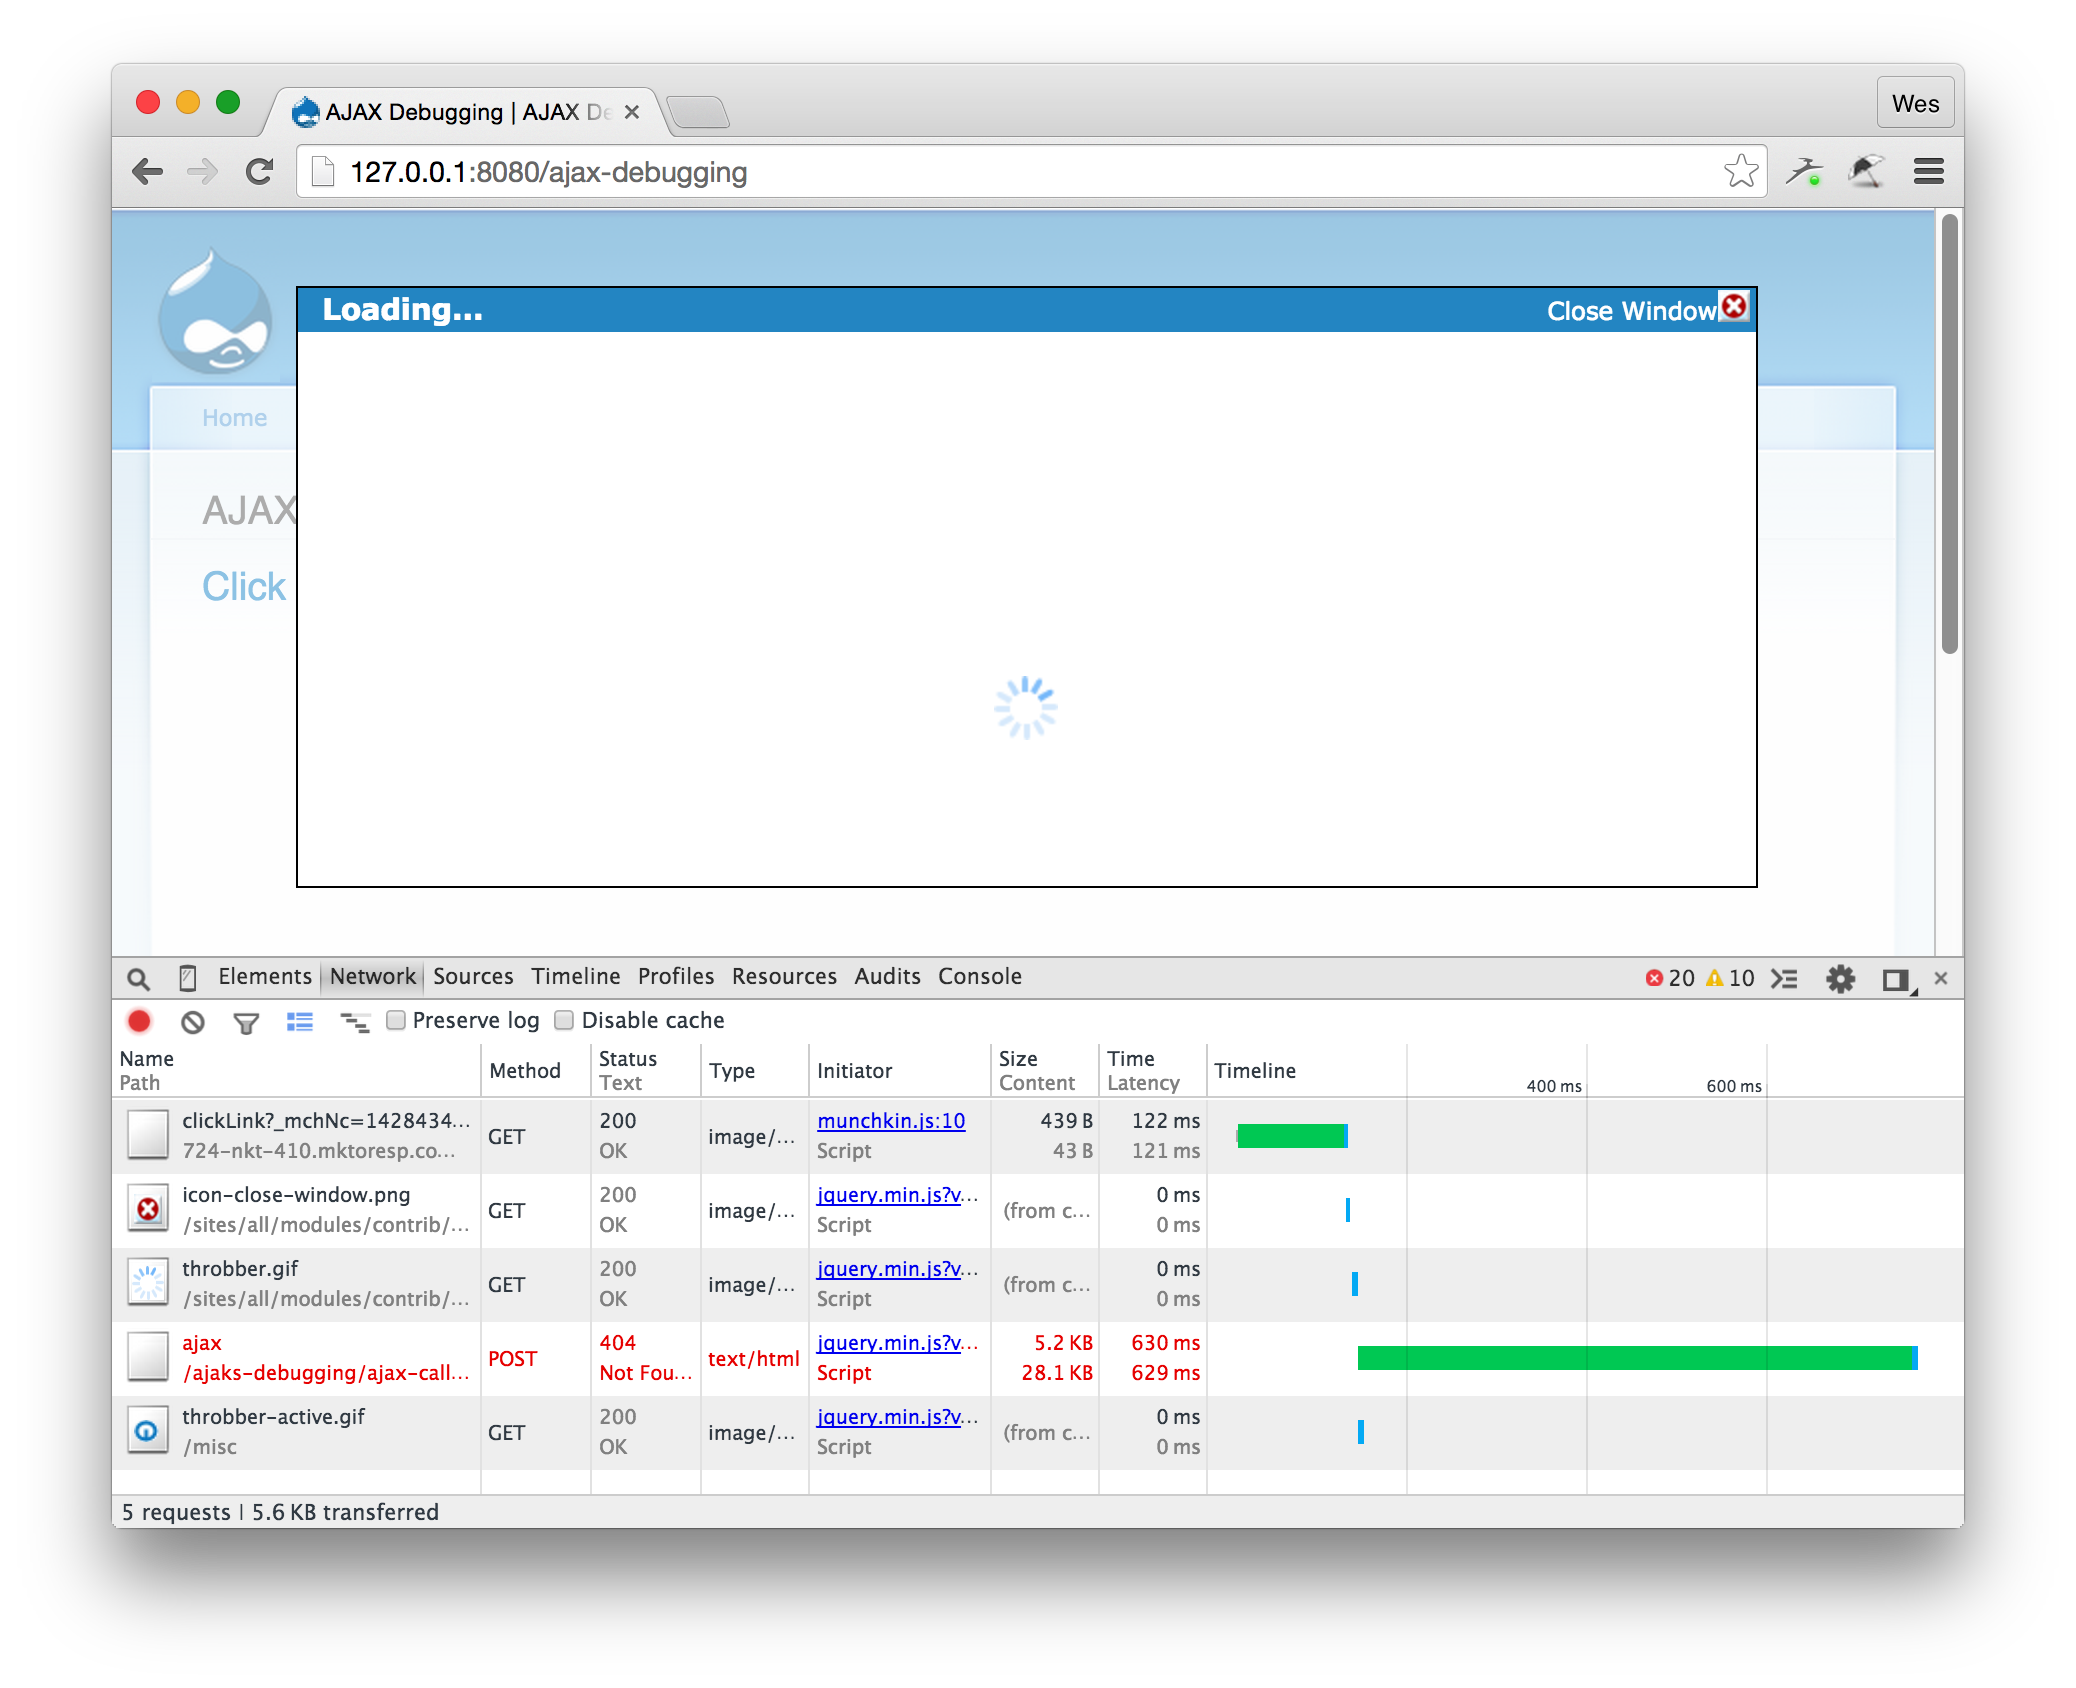
Here you can see that my AJAX request sent back a 404 error.
I can even preview the content, as if I navigated to that URL in the browser and passed all the same parameters:
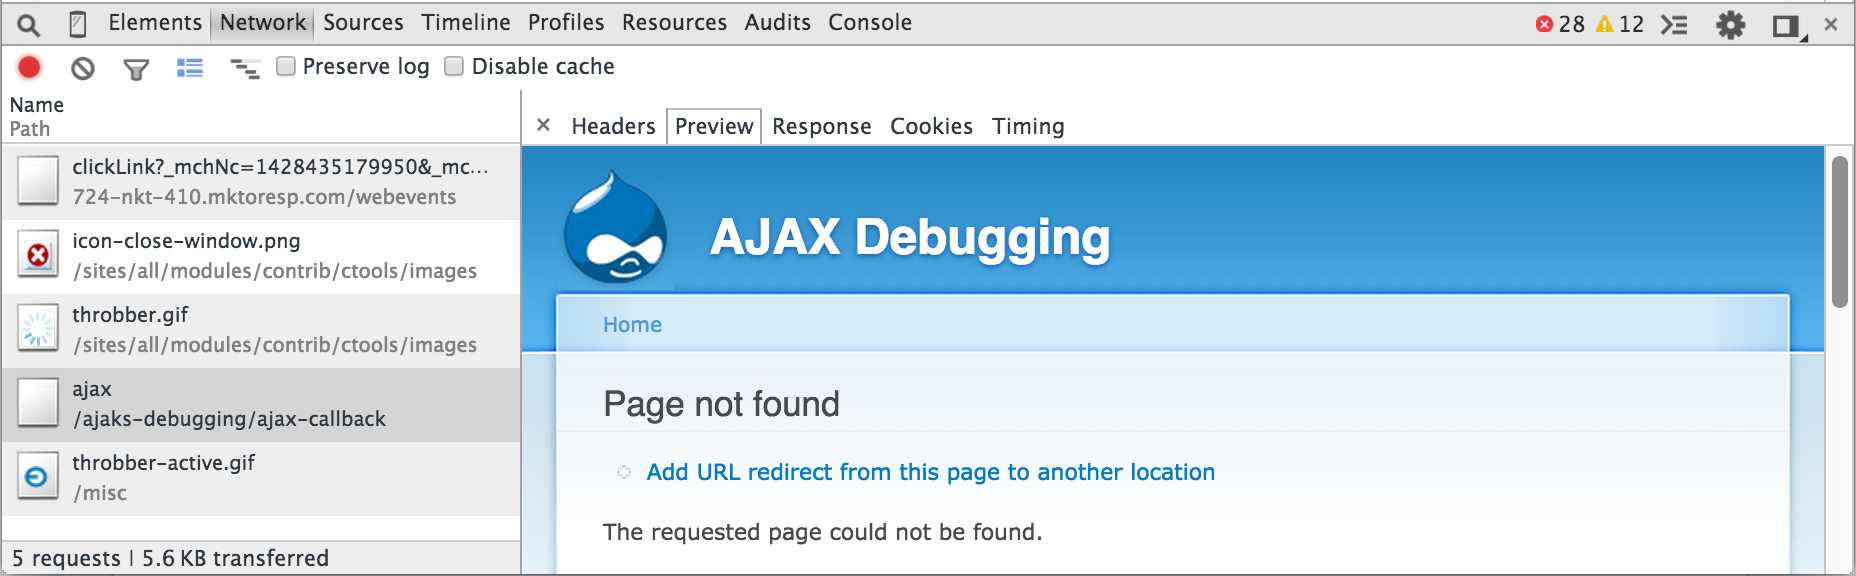
Looks like I had a typo in my code. Found it!
A Bit Dirtier
Sadly, sometimes it’s not that simple. Your code may have a subtle bug that won’t kick back a PHP error or 404.
For that, I like to use this handy trick. The Krumo array inspector provided with Devel module isn’t available here, so I’ll fall back on good ol’ print_r(). Stepping through the code line by line, I output my variables using this bit of code:
print_r($form_state); die();
This will immediately stop the script execution and prevent any more HTML clutter filling up the AJAX response. We get this in the “Responses” tab of the HTTP request:
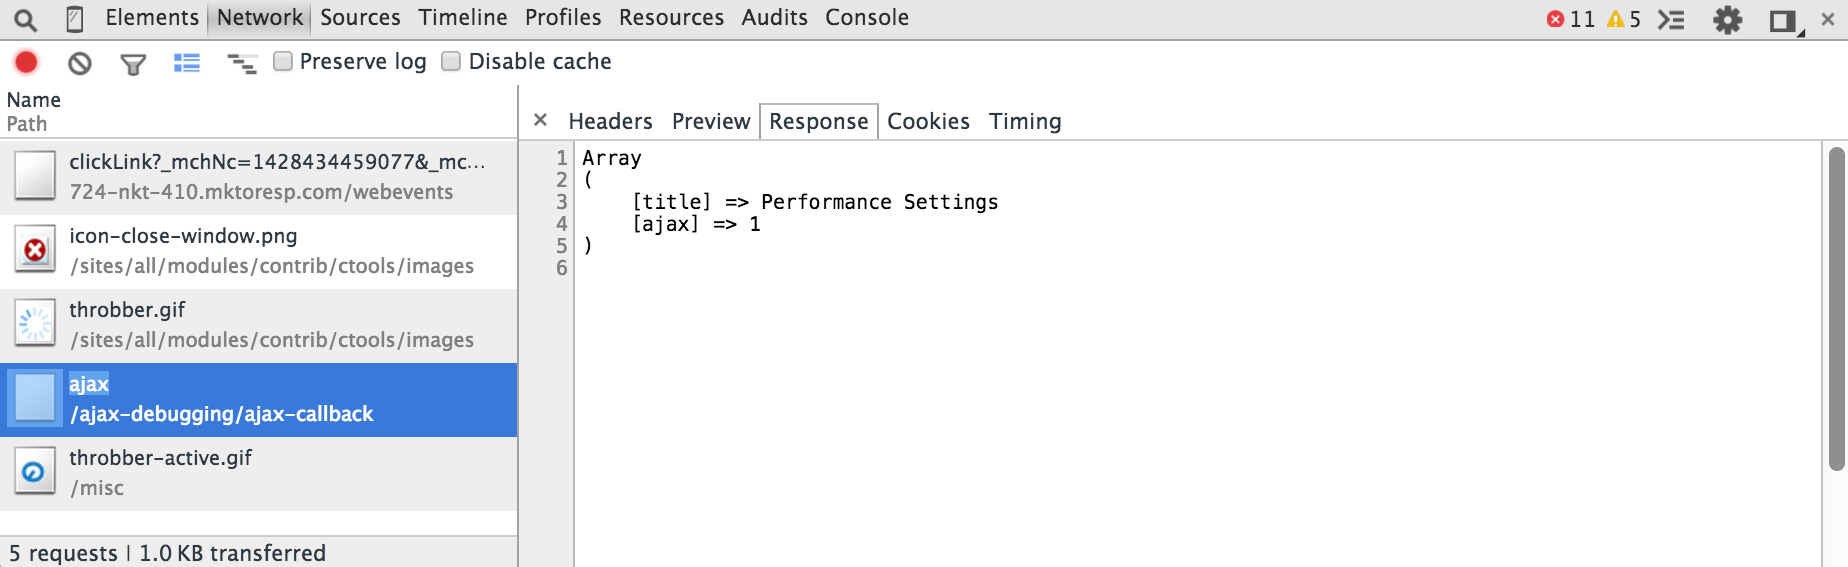
Now that’s better! I get a nice clean output of my variable and I can check for any unexpected data values.
More Tools
This is just one way of doing it. Here’s some other techniques you can consider using:
- Use Devel module’s dd() function to log to a text file and view that file in the Console.
- Install Devel Debug Log and use the ddl() function to log to watchdog, complete with the full Krumo output of your variable.
- Outside of the browser, use a network monitor or HTTP proxy, such as Charles Web Debugging Proxy.
If you’re struggling to work through the CTool modal framework, try debugging using Network Inspector and any other tools you have available. Don’t let that modal get you down!